
This is the second in a series of six articles about crime reduction. Links to the other articles in the series are listed at the bottom of the page.
In 2009, city officials in Middletown, Ohio, USA, were concerned that housing voucher subsidies were driving the increase in police calls for service. The police stepped up patrols in areas with many voucher recipients. This did not work, so the police asked a University of Cincinnati team (including coauthor John Eck) to help find a better approach to reducing calls for service. Using data from Middletown, the team uncovered that most properties with housing vouchers had very few calls to the police, but a small proportion of these properties
generated many calls. And this was also true for properties with no voucher recipients. In short, calling the police was not widespread among any group.
The team looked at who owned the properties with many calls. It turned out that most property owners had residential units that generated few calls to the police. But the properties of a small percentage of the owners created most of the calls. (Analyses ruled out the possibility that owners with more units had more calls.) This was true for both voucher properties and non-voucher properties. So, the team recommended that the police focus their attention on the relatively few property owners whose properties generated most of the calls.
In this example, city officials acted as if they thought crime was widespread, or widespread among housing voucher recipients. But the evidence indicated that crime was very concentrated. It was concentrated among a relatively few addresses and among a relatively few owners of these addresses.
It is not surprising that city officials acted as if crime was widespread. Watching the evening news or reading internet postings, one gets the impression that crime is everywhere, particularly in high-crime neighborhoods. But rolling out blanket strategies across neighborhoods, or for large population groups, often is a costly mistake.
In this article, we show why this is a mistake and how you can craft anti-crime initiatives that reduce crime, cost less, and don’t antagonize communities.
The Law of Crime Concentration
In 1989, Lawrence Sherman and two other researchers discovered that, in Minneapolis, 22% of the addresses experienced all the robberies, that 27% of the addresses experienced all the auto thefts, and that 11% of the addresses experienced all the burglaries. Overall, 10% of Minneapolis’s addresses had about 70% of all calls for police service. And 40% of the city’s addresses had no calls for service. Even in high crime neighborhoods, most places had little or no crime, but a few had a great deal.
In the third of a century since their groundbreaking discovery, multiple researchers have replicated Sherman’s findings. John and three of his graduate students reviewed all evidence and found zero studies showing crime is widespread; studies always show crime is concentrated. Across all studies, 10% of the places had 65% of the crime. Keep in mind, “place” is an
address or a street segment. It is not a neighborhood.
Perhaps just as startling, it does not matter what type of place you are considering. Most bar crimes occur in a few bars, and most bars have little crime. Most motel crimes occur in a few motels, and most motels have little crime. This pattern is true of bus stops, construction sites, parks, worship places, apartment buildings, convenience stores, bigbox stores, and every other type of facility researchers have studied. There are no exceptions. This fact is so important that crime preventers use “risky facility” analysis to focus attention on the places that matter.
In 2010, Aiden Sidebottom and Kate Bowers of University College London examined the theft of bags in 26 British bars belonging to the same chain. The most bag-theft prone bar had 22% of all the bag thefts. The five most bag-theft prone bars had 59% of all the bag thefts. The researchers looked at whether it was the large bars that were the biggest problem; they weren’t—bar size did not drive thefts, apparently.
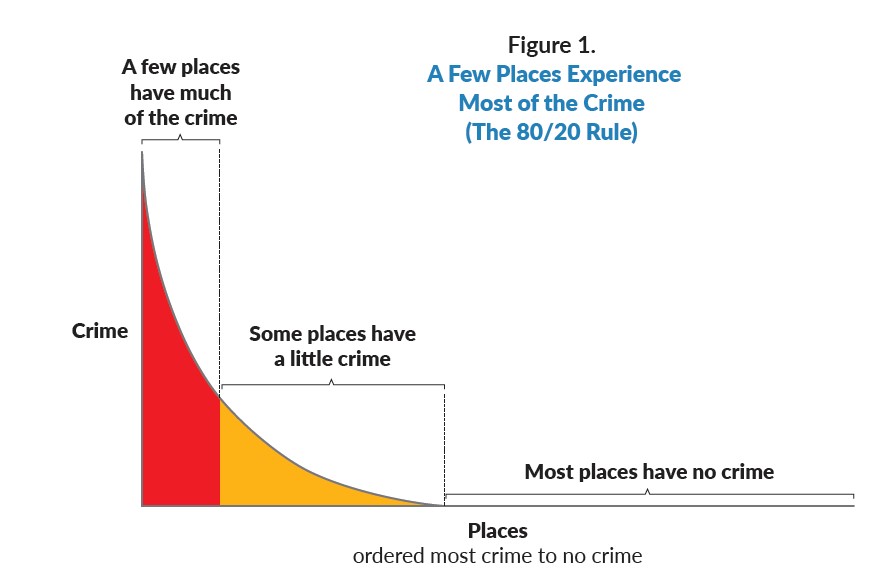
Crime concentration is an example of the rule you may know of as the 80/20 rule. Most of anything (the 80 part) is created by a small number of things (the 20 part). Though we use the numbers 80/20, the numbers are seldom actually these, but there is always a large number that is due to a small number.
You have probably encountered the 80/20 rule in your work. Most of your employees do a fine job, but a small proportion cause most of your headaches. The 80/20 rule is true of offending. A very small proportion of people commit most of the crime. We need to focus our attention on them. And data shows it is true of victims. A small proportion of victims are
involved in a large percentage of the victimizations. We need to focus our help on them. And so it is with addresses, property parcels, businesses, and other very small places.
When preventing crime, we often see a curve like the one in Figure 1. If we rank addresses from the highest crime location on the left to the zero crime places on the right, and then
plot how much crime is at each place, we always see a curve that looks like a hockey stick, with the blade sticking up on the left and a long handle to the right.
Risky Facility Analysis
That crime is highly concentrated at a relatively few tiny places—addresses, land parcels, homes, businesses—continues to surprise policy makers. But don’t take our word for it. Take the crime concentration challenge in your city, town, or county. Here is how. Estimate the number of addresses and street corners, produce a list of all crimes in a year or two years, and then aggregate crimes by the address where they occurred. Count the number of addresses with one or more crimes. Subtract this count from the total number of addresses. You should immediately notice that you have far more addresses with no crime than addresses with one or more crimes.
Now, rank the addresses with crime from the single address with the most crime to the many addresses with a single crime. If you plot the number of crimes at each address, you will see the most crime on the left end of your chart and the fewest on the right. Finally, find the most crime-prone addresses—say, the worst 10% (the 10% on the extreme left) and calculate the percentage of your city’s or county’s crime at those places. You have now completed a “risky facility” analysis.
We guarantee that the worst 3–7% of the places will probably experience 50% or more of the crime. If you have the time, do the same calculations for each neighborhood of your city/county. We know what you will discover (not the precise numbers, but the broad pattern).
How can we be so sure of your findings? Because we have looked at every study of crime that has attempted to do these calculations. They all show the same results: crime follows the 80/20 rule. Crime follows this rule in the United States and every other country where anyone has bothered to gather and analyze the data. It follows the rule in big cities and small cities. It follows it in any subdivision of cities: census tracts, police districts, planning areas, and so forth.
Focus on Places, Not Neighborhoods
In short, crime is seldom a neighborhood problem. Crime is usually a place problem. From this fact comes three simple rules for crafting useful crime reduction initiatives. First, focus on very small places: addresses, if possible; street segments (a street from intersection to intersection), if necessary. Second, use the 80/20 rule to identify the highest crime places. Third, ask why crime is so great at these places but not in other nearby places?
Doing these three things—focusing on addresses, using the 80/20 rule, and asking why—improves the chances that your crime prevention initiative will reduce crime because it focuses resources where they are needed rather than thinly spreading them where they are not. It can reduce costs because you are not spending resources where they are not needed. And it reduces the chances that the initiative will involve people who have nothing to do with the problem.
Recall the Walmart example in our previous article. Theft was not a problem of Paducah or a neighborhood in the city. It was a problem with two stores. This is the same result that Sidebottom and Bowers found in British bars; bags thefts were not a neighborhood problem, they were mostly a problem in five bars.
If neighborhoods were not driving crime, what was? Paducah not only had two Walmarts, but it also had a Sam’s Club. All three are owned by the same corporation, yet the Sam’s Club was virtually crime free. But the two types of big box stores have two different management styles: one style fosters shoplifting and the other does not. In the British bars, what separated the many low-theft bars from the few high-theft bars? The high-theft bars had two doors that patrons could use, but low-theft bars had only one door. Two doors made it easier for thieves to enter, pick up a bag, and walk out the other exit without doubling back. The number of entrances is also a management decision. In both examples, the source of the trouble comes back to how the places were managed.
Conclusion
The title of our article asks a question: Is crime widespread? Our answer is no. If you spread your scarce resources across your city to fight crime, or even across a neighborhood, you will spread them too thin.
Instead, ask yourself, does the 80/20 rule apply? When you focus resources on the relatively few places that have most of the crime, you will do better.
We’ve shown you that identifying the few places with the most problems is your most efficient way to reduce crime. Knowing where to focus your city’s or county’s resources is an important step. But what do you do next? Often, there is an urge to partner with people in the community. But which people? In our next article, we explain who you should work with to have the greatest impact on crime.
SHANNON J. LINNING, PhD, is an assistant professor in the School of Criminology at Simon Fraser University in Vancouver, Canada. She researches place-based crime prevention and problem-oriented policing.
TOM CARROLL, ICMA-CM, is city manager of Lexington, Virginia, USA, and a former ICMA research fellow.
DANIEL GERARD is a retired 32-year veteran (police captain) of the Cincinnati Police Department, USA. He currently works as a consultant for police agencies across North America.
JOHN E. ECK, PhD, is an emeritus professor of criminal justice at the University of Cincinnati, USA. For more than 45 years, he has studied police effectiveness and how to prevent crime at high-crime places.
Other articles in the series:
Part 1: Do Solutions to Crime Need to Be Complicated?
Part 3: Do Residents Matter Most in Reducing Crime?
Part 4: Do More Arrests Reduce Crime?
Part 5: Can the Police Solve All Crime Problems?
Part 6: How Can You SCRAP Crime Proposals that Are Likely to Fail?
Publish with ICMA!
We’re searching for interesting and insightful stories that can help others learn a memorable takeaway to serve their communities better.