
How local governments report performance data often depends on whether they have tied those measures to an adopted strategic plan. Doing so can give structure and significance to the measures you choose to collect.
The process of identifying strategic linkages can also help determine whether other measures are more indicative of workload, but not necessarily of strategic importance. This is not to say that such measures should be abandoned, but potentially that the audience for those measures is more internal than public-facing.
So, if your jurisdiction has narrowed your focus to a strategic priority list, does that mean that’s the extent of what you should be reporting? Not necessarily.
Obviously, the year 2020 brought significant changes that affected all of our communities, ranging from public health to financial crises to an enhanced focus on social justice and equity. Even if none of these had been included in long-term strategic plans, all gained new relevance and interest among members of the public. Seemingly tangential issues, like the efforts to retain poll workers for elections, took on new significance.
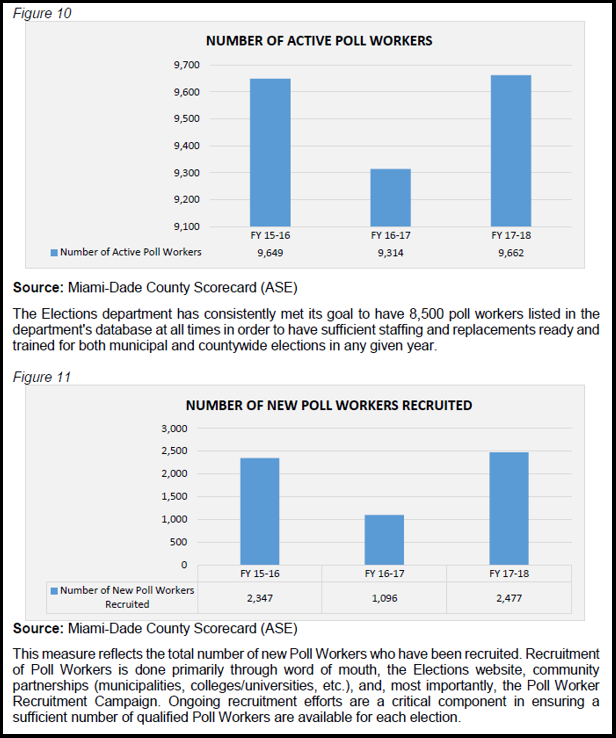
Poll worker recruitment data may not be the top priority performance metric every year, but such lower-profile metrics may take on added significance when unanticipated situations arise, such as pandemics.
More generally, the list of a jurisdiction’s performance measures should be:
- Consistent enough to analyze trends and the impact of changes in staffing or funding, but also
- Agile enough to add one-time or short-term measures to meet community needs.
For example, natural disasters are unpredictable, but they occur frequently enough that managers can prepare to measure their performance as part of their contingency planning. While first responders may be focused on rescues and evacuations, budget staff, analysts, and GIS specialists might be tasked with tracking the effectiveness of emergency shelter operations, communications plans, or restoration of services.
For departments that are still performing the same types of services they always have, the large-scale implementation of distancing and work-from-home might mean that new measures are called for to assess the effectiveness of or satisfaction with online services.
Budget staff or analysts from around the organization may be able to offer advice, set up dashboards, or seek the public’s input on whether the data that’s being shared is meeting their needs. You could either deploy those staff as you would a special projects team or use business intelligence software to generate alerts about opportunities for process improvement.
Performance Pre- and Post-COVID
Not everyone has the budget to roll out a business intelligence system, but all governments have the option of reaching out to their peers to determine what trends they are seeing pre- or post-COVID.
ICMA’s Open Access Benchmarking program provides no-charge access to more than 20,000 data points available for comparison around 80 key metrics, so you can see how you are performing over time or compare to other agencies.
In preparing for next budget, such data can help you communicate to local residents:
- Have workloads continued even as staffing has declined?
- Have expenditures per capita increased or decreased?
- Is the experience in your jurisdiction unique or similar to what others are experiencing?
|
Open Access Benchmarking: Sample Metrics |
Avg, all responses |
# of responses |
|
Fires in Residential 1-2 Family Structures: Percentage confined to object or room of origin |
59% |
172 |
|
Paved lane miles assessed as satisfactory as a percentage of miles assessed |
72% |
151 |
|
Turnover rate: All full-time employees |
6.0% |
253 |
|
IT expenditures per endpoint served |
$2,808 |
171 |
|
Calls for service per sworn police FTE |
437 |
183 |
|
DUI arrests per 1,000 population |
4.1 |
257 |
|
Number of traffic accidents involving fatalities per 1,000 population |
0.07 |
170 |
|
UCR Part I violent crimes reported per 1,000 population |
4.2 |
248 |
|
Workers compensation claims per 100 FTEs |
11.4 |
171 |
Data can be shared at any time here, whether for current or past fiscal years, and there’s no requirement to report for all measures.
‘Budget season’ never really took a break this year. As you prepare for your next round of proposals or quarterly reviews, lay the groundwork for the data you want to be able to share with the public so you can demonstrate:
- How you have worked toward your strategic goals.
- How you compare to others.
- How you have adapted to unanticipated circumstances.
Looking for ideas on how jurisdictions have linked their performance metrics to strategic plans or that have added metrics around COVID or fair administration of justice? Check out the leading practices on the website for the ICMA Certificates in Performance Management. You can also download a copy of ICMA’s E-book on performance management (free to all ICMA members).
Individuals with questions on performance management can contact performanceanalytics@icma.org.
Publish with ICMA!
We’re searching for interesting and insightful stories that can help others learn a memorable takeaway to serve their communities better.