Public managers are inundated with data. But how can you transform the data into useful information?
Performance data should be available to you both at regular performance reporting periods and whenever you need an update to help address current issues. Here are some basic ideas to help you make sense of performance-related data for your use in making decisions.
1. Assign a staff member to review, summarize, and highlight each regular performance report and any special reports you need. The amount of data available is formidable, and you will not likely have the time (or inclination) to review all of it yourself. Ask the analyst to provide summaries, highlights, and critical comparisons that will help you mine that. Ask the analyst to examine the elements suggested below.
2. Compare the latest data both to past performance and performance targets. Already in common use are comparisons of the latest performance data to: (a) previous time periods; and (b) targets that have been set for the reporting period.
3. Examine and compare the performance data broken out by customer demographic groups. Analyze data by such characteristics as age group, gender, race/ethnicity, and home location (e.g., neighborhood, district, precinct, etc.). Such information is vital for identifying where your service is doing well and where not so well. It also is a way to identify service disparities, needs, and inequities.
4. Examine and compare the performance data broken out by other characteristics that are particularly likely to affect performance. For example, for road maintenance, the condition of roads might be broken out by type of pavement or amount of average daily traffic. For water and sewer services, performance indicators such as “number of pipe breaks” and “amount of pipe water leakage” might be broken out by pipe size and composition. This information is needed for identifying the characteristics associated with good and bad outcomes.
5. Examine and compare the performance data by individual service unit and service delivery approach. This comparison is used where multiple service units of the same type deliver basically the same service (e.g., fire stations, police stations, libraries, recreation centers). This information is important for identifying which units and which service delivery approaches are working as well as expected and which are not.
This exhibit shows what such a disaggregation report might look like. It compares the data on one outcome indicator (clients that reported improved functioning after completing group therapy) for each of three demographic characteristics (gender, age group, and race/ethnicity) and for each of three service characteristics (sessions attended, facility providing the service, and caseworker). I have circled a few numbers that indicate major differences in the outcome values. These would likely warrant special attention.
QUESTION TO YOU: Given the data in the exhibit and no other relevant information, what might you say to Caseworker C about his/her performance?
6. Compare performance by the level of difficulty of the incoming workload. This comparison is applicable to many services but is seldom directly made. Its importance is most obvious in such services as health and employment. Identify characteristics of customers/clients/patients that are likely to make helping them more difficult—and more expensive--such as educational level, health status, or level of substance abuse at intake. These comparisons can be highly useful for avoiding unfairly criticizing staff if the reason for less positive outcomes is that their customers are more difficult to help. Might such information affect your response to the question about Caseworker C above?
An example: This exhibit shows outcome data for two (fictitious) hospitals.
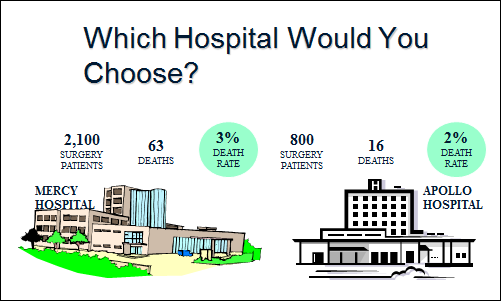
QUESTION: Based only on the data shown in the exhibit, to which hospital would you send your mother?
Now look at this next exhibit, which also breaks out the outcome data by the condition (good or poor) of the incoming surgery patients.
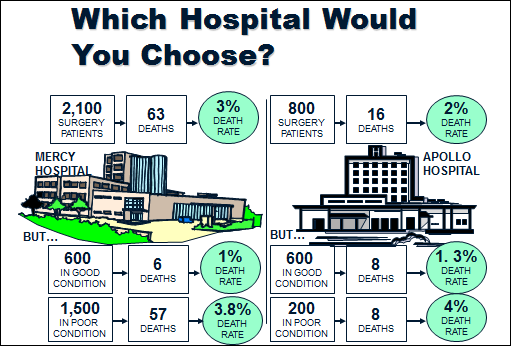
Now to which hospital would you send your mother?
7. Seek explanations for unexpectedly poor or very high performance. This is a natural step for managers. Here are some ways to obtain explanatory information:
(a) Use the performance data disaggregations suggested in steps 3-6. That information can provide highly useful clues as to the nature of problems, helping you better target your approach to solving them.
(b) Obtain feedback from your own staff, especially field staff who work with customers.
(c) Obtain feedback from customer focus groups.
(d) Examine customer responses to questions asking why they gave low ratings to some services in customer surveys (as suggested in the earlier post Are You Helping Your Customers? Let's Find Out.
Here is an example of how the performance information from steps 3-7 can be useful in making program decisions:
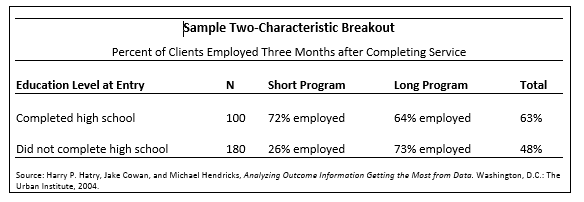
The table compares important outcomes for each of two service delivery approaches (distinguished by length of the training program offered by a local agency) and for two levels of education of the entering program clients.
QUESTION: What actions do the data in the table suggest? The data indicate that clients who had not completed high school should be encouraged to enter the long program version with its substantially higher likelihood of helping clients obtain employment. Those clients who had completed high school can be encouraged to attend the short program version without losing employment potential (and this would also save the program money).
Modern technology has given us data-mining tools that can readily provide the disaggregations suggested in steps 3-6—and in a reasonably timely way. This is not rocket science. These are tools every manager should have—and use.
Adapted from Harry P. Hatry, Transforming Performance Measurement for the 21st Century, Section 3, published by the Urban Institute, 2014. An important use for this analysis is discussed in the earlier post Using Performance Data: Regular Data-Initiated Reviews. Suggestions for obtaining data for the analysis is discussed in the post Are You Helping Your Customers? Let’s Find Out.
Publish with ICMA!
We’re searching for interesting and insightful stories that can help others learn a memorable takeaway to serve their communities better.