About two years ago, ICMA published a highly popular article called “How Are You Doing? Performance Information for the Public.” It provided tips for bringing performance information to life, plus vivid examples from local government websites and public documents.
It was so well received that we’re sharing it again—with brand new examples.
Reporting performance information to the public can be scary, because whatever data you collect can become grist for public records requests, disgruntled bloggers, public hearing gadflies, or local media—often looking for a scoop about “government inefficiency.”
This is especially true if your performance measurement/management initiative is relatively new. But once your efforts reach maturity, it’s time to put the information in front of the public—often by posting it on the city or county website.
ICMA has collected tips to help take the fear out of performance reporting, and they're available in this Checklist, which shows how you can put the information into context for the public. And here are some great examples from recipients of Certificates in Performance Management. One of the criteria for the certificate is public reporting using graphs, color-coding, dashboards, and other means to highlight performance above/below expectations or varying significantly from past or comparable data.
For example, the Durham, North Carolina, website provides a graphic display of the city’s strategic plan, “One Vision-Five Goals.” Here’s an excerpt from the goal “Strong & Diverse Economy,” showing two indicators plus a key to the color code. Visitors can click “View Initiatives” for detail, also color-coded.

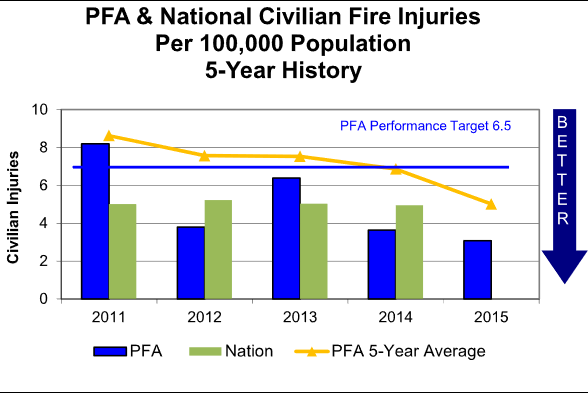
This report from the Poudre Fire Authority (PFA) in Colorado charts its organizational performance against national data and provides its performance target and a trend line showing its five-year average.

In its Municipal Benchmarking Report, Greer, South Carolina, compares both current performance and recent trends to a list of area benchmarks.

Coral Springs, Florida, conducted a Business Survey that tapped the views of owners and senior managers about ways to improve the quality of city services. Here’s a visual display of satisfaction ratings for departments.

All of these examples show how large quantities of performance data can be presented in meaningful ways that demonstrate accountability to the public.
Are you reporting your performance data yet? If not, you may be missing the opportunity to increase public engagement and understanding of local government results.
Not sure where you’ll find the comparative data you need? Check out ICMA’s Open Access Benchmarking program for data on 80 consistently-defined Key Performance Indicators (KPIs) for local government with no software requirements, no reporting deadlines, and no charge to participate.
New, Reduced Membership Dues
A new, reduced dues rate is available for CAOs/ACAOs, along with additional discounts for those in smaller communities, has been implemented. Learn more and be sure to join or renew today!