Yes, response time is important and so are crime rates, arrests, clearances, and citizen satisfaction. But what else do you have to show us?
As a society, the sheer volume of data makes it difficult for the public to draw any conclusions as to its meaning. Likewise, when talking about high-profile issues like policing, there’s an awful lot of noise generated around the topic to distract from the more reliable statistics.
As the dust settles after the Presidential election, we may have a brief respite from the conflicting narratives around whether crime rates are rising or falling, where that’s happening, and using what base year(s). Before the 2020 election season starts (ok, it already has, but bear with me), cities and counties have a window of opportunity to revisit their policing metrics and give some thought to how they want to measure and report their own performance, rather than having some outside interest groups measuring it for them.
Crowd Dynamics
One of the hot button issues that National Park Police shies away from is crowd estimation. Every group that marches on the National Mall wants to say they attracted a crowd of 500,000, 1 million, or more. This helps publicize their cause, but puts the police in the position of either: 1) underestimating the crowd, and thus provoking the sponsors’ ire, 2) overestimating the crowd, and contributing to a spiraling of ever-higher numbers not based in reality, or 3) wisely remaining silent.
But from a practical standpoint, there are very good reasons to estimate those crowds. Knowing the crowd size for any special event helps you to know what you or the organizers may need in the way of security staff or overtime officers. If there’s precedent (e.g., last year’s parade, marathon, protest), you can start from that experience. But you can also work from proxy measures to estimate the crowd size: Are hotel bookings up? Is there a tent city? How many buses are ferrying people in or out?
Right now, Native Americans and environmental activists are gathering in North Dakota to protest a pipeline under the Missouri River. One of the tactics supposedly being employed is for both those in attendance and those who have no intention of traveling there to “check in” on social media, under the assumption that law enforcement will be monitoring such communications to gauge crowd size or conduct surveillance. Rather like a modern version of the entire Twitterverse saying “I’m Spartacus,” the concept is to keep police too busy to focus on any one group.
While social media buzz might be one proxy measure of crowd dynamics, if that’s not a reliable indicator for you, more pedestrian metrics may work just as well. What’s the acreage of the territory, park, campus, or music festival involved? How many tons of trash are being hauled away? If you’re looking at smaller-scale events, you might look at how the pizza delivery or coffee house business is going. Or if it’s an event that you’re organizing yourself, talk to the port-a-potty vendors about their performance metrics too.
Do those measures sound too indirect to you? Then keep in mind how FEMA tracks data from Waffle House.
Focus on Process
Statistics can tell us a lot about trends involving large numbers of similar incidents, such as speed law violations or robberies by location or time of day. They don’t do as well to describe occurrences that are unique. For instance, when there is an officer-involved shooting in a small community, that may be the first such shooting in several years. If you were to look at the incident rates, they would be 0% every year, or 0 per 1,000 incidents, then some other number that would still be fairly low. But just displaying that data would not provide the public with any context to understand whether your department is operating effectively and judiciously or not.
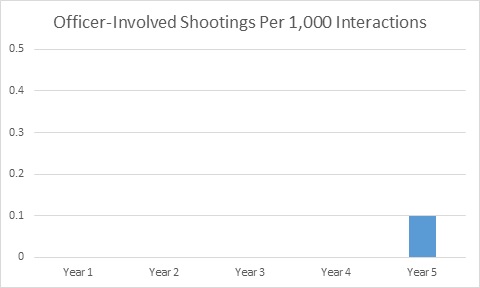
If your number of incidents and target value is low (or zero), a single incident is hard to contextualize. Consider comparisons to benchmarks and process measures that may show what you’re doing to prevent or better manage those incidents.
Where a clear target exists, you could superimpose that target on a graph to show where you aspire to be. That would be the case if you’re trying to achieve 95% of responses in a given amount of time. But since everyone prefers to have 0 shootings, a target value alone may not provide sufficient context. Should the scale run from 0-0.5, as shown above, or 0-.02 (which may make your performance seem more extreme)? Benchmarks from other jurisdictions might help, and that’s one area where ICMA remains committed not only to data sharing but also to defining metrics consistently.
In addition, as talk continues around issues of fairness, profiling, and organizational culture, you can also look at process measures in your own operations:
- What percentage of sworn staff have completed training on key community-sensitive topics within the past three years?
- If dashboard cameras or body-cameras are available within the department, what percentage of vehicles or officers have them?
- In what percentage of traffic stops or other community interactions did the officer properly adhere to department policy regarding activation of that technology (for audio or video)?
- In what percentage of interactions is dash-cam/body-cam footage available?
You may not know ahead of time which incident will become a flashpoint for your community, but if you’re tracking the routine process measures, you can identify and react to any gaps in your training or technology implementations before they become fodder for lawsuits later.
The Big Table vs. the Big Table
Interagency task forces have often worked together very effectively on interdiction of drugs, terrorism, and gangs. But whether addressing the opioid epidemic, truancy, civic health, or other cross-cutting social issues, the big data we’re each collecting also needs a big (conference) table. Seated around it should be data specialists from cities, counties, school districts, health care providers, community non-profits, and even private-sector partners, all prepared to pool data, develop strategies, and communicate that information to the public in a way they can relate.
What the public doesn’t need is a big (data) table. No problem is ever solved by throwing a bigger spreadsheet at it. And even if that large spreadsheet does happen to contain some valuable information somewhere within it, your local residents won’t have the patience to sort through your budget or open data portal to find it.
The temptation is to place the nugget you want to convey into an infographic, but that might be equally ineffectual. Too often, these infographics show workload (“Responded to 5,000 calls for service”) or fun facts (“6 neighborhood/storefront precincts”), rather than dig into the outcomes you’re trying to achieve.
If you’re going the infographics route, seek some feedback from the others at that big conference table and the folks in your community. After they’ve scanned your infographic, do they have any better understanding of what you’re achieving? And if their agency or neighborhood association is facing the same issues, do they see how they could fit into your graphic as well, or are you implying that your agency is doing it all on your own?
Eye on the Sparrow
Whether that phrase makes you think of the hymn or the 1970s police show Baretta, the point is that details matter. We all need to pay attention to those details, both for our own management of policing operations and for effective engagement with an often-skeptical public.
New, Reduced Membership Dues
A new, reduced dues rate is available for CAOs/ACAOs, along with additional discounts for those in smaller communities, has been implemented. Learn more and be sure to join or renew today!