Most local governments struggle to find meaningful performance measures for the many lines of municipal business. Equally daunting is putting timely performance data in the hands of the people who can best use them to become better “evidence-based” policy makers and managers.
During the recent Alliance for Innovation webinar, Performance Management Tools and Techniques, Williamsburg, VA shared their performance management journey and how it is integrated into the way business is done.
In Williamsburg, every other year the council redefines their strategic priorities for the following two years, known as their Biennial Goals, Initiatives and Outcomes (GIO’s). Currently, the GIOs contain 10 general goal statements, about 80 concrete initiatives, and 60 outcome measures and ratings. Initiatives are specific and measurable projects and activities over that advance the goal. Initiatives are not a comprehensive list of services and activities, but rather new actions or changes in direction.
Additionally, quantifiable “Key Outcome Measures” are established for each of the goals. According to City Manager, Jackson Tuttle, “In Williamsburg, we believe Key Outcome Measures best assess progress toward achieving the big goal.”
Tuttle went on to say, “I would argue that the most consistently useful measure of outcomes in government is citizen perception. Using the National Citizen Survey and national benchmarks, we compare ourselves not only against our past performance, but against other localities across the country.”
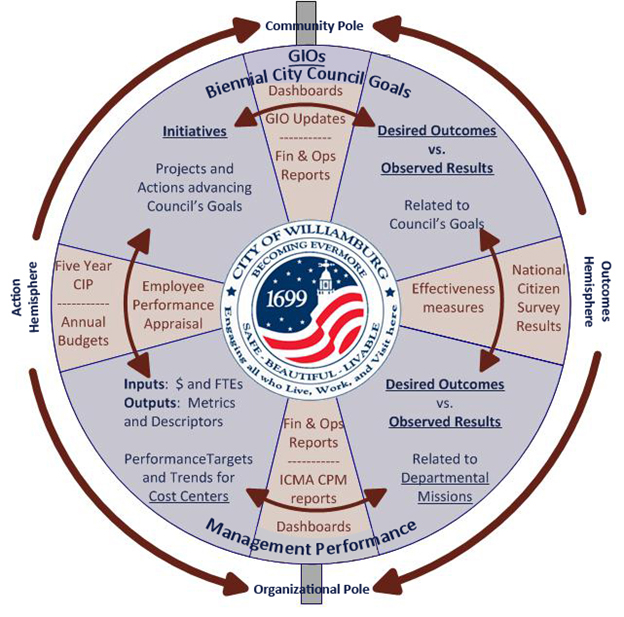
Williamsburg’s Performance Management Model is set up like a globe with the city’s vision statement abbreviated in the center.
The “Community Pole” looks at performance management from the viewpoint of citizens and City Council. They are interested in policy and priorities, and in outcomes. Here we find the elements of Council’s Biennial Goals, Initiatives and Outcomes. Reporting mechanisms are in the red wedges – dashboards and periodic reports.
At the “Organizational Pole,” the emphasis is on operations – inside the departments of the city. Here Williamsburg focuses on Inputs in terms of dollars and people; and on Outputs of our processes. Performance targets are set, and trends recorded, at the cost center level. Outcomes are also assessed by reporting “observed results” against “desired outcomes” relative to departmental missions.
For both poles, the right hemisphere is the “Outcomes Hemisphere.” At both the community and the organizational levels, the focus is not on process, but on results. So, here we find effectiveness measures and citizen survey results.
And for both poles, the left hemisphere is the “Action Hemisphere.” Annual operating and capital budgets, and individual employee performance appraisals, implement and track action steps required for high performance.
Williamsburg uses the annual budget and financial report as a tool to communicate progress on key performance measures.
Williamsburg’s emGovPower software standardizes and automates these reports, pulling numbers from existing city data bases, so staff only records the raw data once in public and organizational dashboards that are used to present data visually and dynamically.
According the Tuttle, “The dashboards are a creative and promising part of the system that produces charts and graphs to better display performance metrics and monitor operations. “ Just like a speedometer, these performance dashboards are updated continuously from live databases. Tuttle concluded by saying, “We now have the capability for everyone in the City of Williamsburg, who needs or wants a performance dashboard, to have one tailored to their particular needs, available on their PC or laptop or tablet.”
Checkout Williamsburg, VA’s performance dashboards at www.williamsburgva.gov.
New, Reduced Membership Dues
A new, reduced dues rate is available for CAOs/ACAOs, along with additional discounts for those in smaller communities, has been implemented. Learn more and be sure to join or renew today!