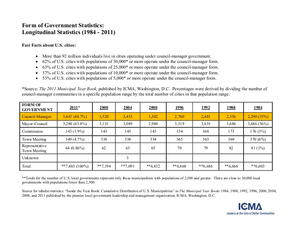
This table presented in this document shows longitudinal form of government statistics, in four-year increments, starting in 1984 and ending in 2011. Comparing council-manager and mayor-council structures, one can see how the council-manager structure has become the most prevalent form of local government structure as it has increased by 59% while the mayor-council structure decreased by 11% when comparing 1984 to 2011. (Council-Manager Form Resource Package)