
By David Gottesman, Andrew Kleine, and Kendra Parlock
“Stat” (statistics) programs are anything but static. As the use of performance information becomes standard operating procedure in local government, how data is used to identify and solve problems and improve service delivery is evolving rapidly. Cities and counties are trying new things and sharing ideas about what works and what doesn’t, practically in real time.
This article takes a quick look back at how Stat got started, then shows how a regional collaborative called the Mid-Atlantic StatNet (MASN) is accelerating the pace of change in the art and science of data-driven government.
We have gathered four case studies from MASN members—Montgomery and Prince George’s counties in Maryland; Alexandria, Virginia; and Baltimore, Maryland—that provide an overview of emerging best practices and how far Stat has come from its early days.
The Origins of Stat
The Stat movement can be traced back to the New York City Police Department’s (NYPD) CompStat (Compare Statistics) program, which is credited with dramatically reducing homicides starting in the mid-1990s. CompStat was the brainchild of Jack Maple, a transit cop who marked crimes in the subway system with crayons and push pins on a huge, wall-mounted paper map, a method he dubbed “Charts of the Future.”
When William Bratton took over NYPD, he hired Maple as his deputy, and they computerized “Charts of the Future” to hold commanders accountable for crime in their precincts, meeting monthly to track progress and adhering to these four tenets:
1. Accurate, timely intelligence clearly communicated to all.
2. A rapid deployment that is concentrated, synchronized, and focused.
3. Effective tactics and strategies.
4. Relentless follow-up and assessment.
In 2000, Baltimore’s new, young mayor, Martin O’Malley, hired Jack Maple to replicate CompStat for his police department. O’Malley quickly realized that the CompStat approach could be applied across city agencies. CitiStat was born and has since been copied by dozens of local governments around the country and the world, with names like LouieStat, PhillyStat, and ChattaStat.
Mid-Atlantic StatNet
A decade after O’Malley started CitiStat, this article’s author Gottesman was the director of budget and performance management for North Hempstead, New York, a town of 230,000 on Long Island’s north shore bordering the New York City borough of Queens. He was running a Stat program, but because he was ahead of the curve among local governments like his, he had nobody to compare notes with.
When North Hempstead’s chief of staff forwarded Gottesman an e-mail about an organization called New England StatNet, he jumped at the chance to observe its next quarterly meeting in Boston. “That first meeting was unbelievable,” Gottesman recalls. “It was energizing to be among like-minded professionals, sharing ideas, and bettering our field and our respective jurisdictions.”
A few years later, when he returned to his hometown of Rockville, Maryland, to take over Montgomery County, Maryland’s Stat program, Gottesman told his boss he wanted to form something like what he saw in New England for the Washington, D.C. region.
In 2013, Gottesman, together with his counterparts Ben Birge in Prince George’s County and Greg Useem in Alexandria, resuscitated the Regional Performance Measurement Consortium, which had been formed by Fairfax County, Virginia, in 1998 but gradually stopped around 2010. They renamed it MASN and recruited members from as far north as Chester County, Pennsylvania, to as far south as the cities of Virginia Beach and Richmond, Virginia.
Because of MASN’s proximity to the nation’s capital, several federal agencies have gotten involved to understand how Stat practices being adopted by local governments can be applied to a federal agency, including the Office of Management and Budget and the Government Accountability Office.
MASN has no budget, so members take turns hosting meetings, which over the years have attracted the “rock stars” of Stat as guest speakers, including data analytics guru Michael Flowers, former Volcker Alliance president Shelley Metzenbaum, and of course, Martin O’Malley.
While the speakers draw people to MASN meetings, member surveys show that the most popular agenda items are the roundtable discussion, when members update each other on their projects and innovations, and technical trainings in such areas as data visualizations and geospatial mapping of data.
This article continues with a MASN roundtable of sorts, starting with Montgomery County.
Montgomery County, Maryland
When people in local government hear the word “CitiStat,” they often envision some poor agency head being browbeaten for failing to fill potholes fast enough. It is true that O’Malley ran his early Stat meetings with a firm hand, but he was confronting a bureaucracy that had become complacent and at a time when performance measurement and accountability were still new concepts.
Many local governments that tried to mimic what they saw in Baltimore’s CitiStat sessions found that a confrontational style did not fit their culture and was counterproductive. This was the case in Montgomery County. When Dave Gottesman came on board as the new CountyStat manager, agency heads who saw him may have wanted to run in the other direction.
Over time, Gottesman has largely replaced the traditional, ever-recurring and staid department-focused Stat meetings with more issue-focused meetings, usually related to priorities that cut across department lines. “Today, CountyStat is more like an internal consultant for departments that need data analytics to solve problems,” he says.
“The job requires more effective relationship-building in order to properly balance performance oversight with data support to ensure we are leveraging all the valuable data we have across the government.”
An example of his team’s evolved role is FoodStat, an interactive map that brings together dozens of data sets to help county officials and other stakeholders pinpoint areas of food insecurity and develop interventions (see Figure 1, “FoodStat”).
The project grew out of the county executive’s food security strategy, but it will soon be adapted to help meet other county goals. The county’s Emergency Management Director Earl Stoddard, for instance, has found that the vulnerabilities related to food insecurity—poverty, language, age—overlap with vulnerabilities to natural disasters.
Stoddard wants to use a tool like FoodStat to help plan for disaster recovery. You can check out FoodStat at https://reports.data.montgomerycountymd.gov/countystat.
Prince George’s County, Maryland
In Prince George’s County, Stat has never involved regular agency data reviews. “We go where the data lead us,” says CountyStat Manager Ben Birge. Like other MASN members, Prince George’s County is moving away from traditional notions of Stat toward “data analytics.” One data analytics project that has inspired other local governments is called the transforming neighborhoods initiative (see Figure 2, “TNI Initiative”).
TNI’s roots are not in CountyStat but in the police department. As part of a 2011 summer crime crackdown, the department used data to identify six areas to target with a flood of county resources aimed at addressing root causes of crime.
When CountyStat was asked to look at the data used for TNI, they threw it out and started with a clean slate. According to Birge, it was “the most intense but fun research project ever.”
Ultimately, Birge and his team settled on 14 data sets that were correlated with either crime or property values and were tied to a county program that could help improve the situation. It turned out that the three highest need areas were not among the six that the county was focused on.
Birge knew that CountyStat’s recommendation to replace three of the six TNI areas would be controversial, but the county executive agreed right away. He wanted to use county resources in a data-driven way. “That was probably the most gratifying meeting of my career,” Birge says.
Four years later, crime in TNI neighborhoods is down more than the countywide average and residents are more engaged in making their communities better. CountyStat continuously monitors data for the TNI areas and is able to intelligently dispatch agency staff to tackle problems. The three replaced TNI areas are now community led.
Alexandria, Virginia
As in Montgomery County, Alexandria’s Stat program started with a top-down approach. In the opinion of Chief Performance Officer Greg Useem, the traditional model had its pros and cons. It got people using data, but it left agency heads feeling like the city manager was going after them.
“Things were getting better at a surface level,” says Useem, “but we weren’t solving the core issues.”
With the blessing of a new city manager, Useem refocused his team on data gathering, dashboarding, and taking deep dives into problems that needed solving. Agency heads took notice and started seeking Useem out for help.
His list of projects now numbers 80, and he gets invited to meetings all the time to help think through tough issues. He has even dropped the “AlexStat” name in favor of “Office of Performance and Accountability,” which better fits Alexandria’s collaborative culture.
One of Useem’s remarkable feats of collaboration involved analyzing a plan to add a fire station. Working closely with the fire chief and GIS team, the Office of Performance and Accountability mapped response times, projected future service demand, and ran scenarios (see Figure 3, “Fire Station Analysis”).
They found that a new station would increase costs by $68 million over 20 years and improve response time by only 0.7 percent compared to the current station configuration and 0.1 percent compared to optimizing the configuration of the current stations.
Useem and the fire chief jointly recommended that the city drop the fire station from its capital plan, and the city council agreed. “You can’t force departments and decision makers to buy in,” reflects Useem. “You need to collaborate with them and convince them.” He did it with data.
Baltimore, Maryland
In April 2017, Governing magazine ran an article by J.B. Wogan titled, “How Stat Got Stuck – in the Place That Made It Famous.” Wogan reported that even as the Stat model continued to spread elsewhere, it was languishing in Baltimore, where leadership’s indifference resulted in months-long periods of inactivity and gaps in data reporting.
Mayor Catherine Pugh, who took office in December 2016, is remaking CitiStat with a focus on citywide outcomes, starting with violence reduction. She has built a whole new team called the Mayor’s Office of Sustainable Solutions, led by Kendra Parlock, one of this article’s authors. Mayor Pugh’s approach has elements of new and old Stat models. It is guided by a violence reduction strategic plan that addresses the root causes of crime, including public health, employment, and transportation. Parlock’s team tracks data and progress on initiatives. Part of Baltimore’s strategy is to target resources to high-crime neighborhoods.
This is accomplished through daily Violence Reduction Initiative performance meetings with 20 agency heads, and weekly community walks in priority neighborhoods. A “walk guide” for one of the neighborhoods is shown in Figure 4. Crime is down 30 percent in these neighborhoods, and service request response times have been cut in half.
Parlock’s team works hand in hand with the city’s budget office so that data informs resource allocation. Together, they have put all performance measure data on a common software platform that enables detailed planning and nimble reporting.
Looking ahead, Parlock envisions performance Stat sessions being internal to agencies, with the team providing expertise on data analysis, data visualization, and process improvement. “We want to keep evolving,” she says.
David Gottesman is CountyStat manager, Montgomery County, Maryland (david.gottesman@montgomerycountymd.gov). Andrew Kleine is the author of City on the Line: How Baltimore Transformed Its Budget to Beat the Great Recession and Deliver Outcomes (Rowman & Littlefield, 2018) (andrew@andrewkleine.com). Kendra Parlock is director, Mayor’s Office of Sustainable Solutions, Baltimore, Maryland (kendra.parlock@baltimorecity.gov).
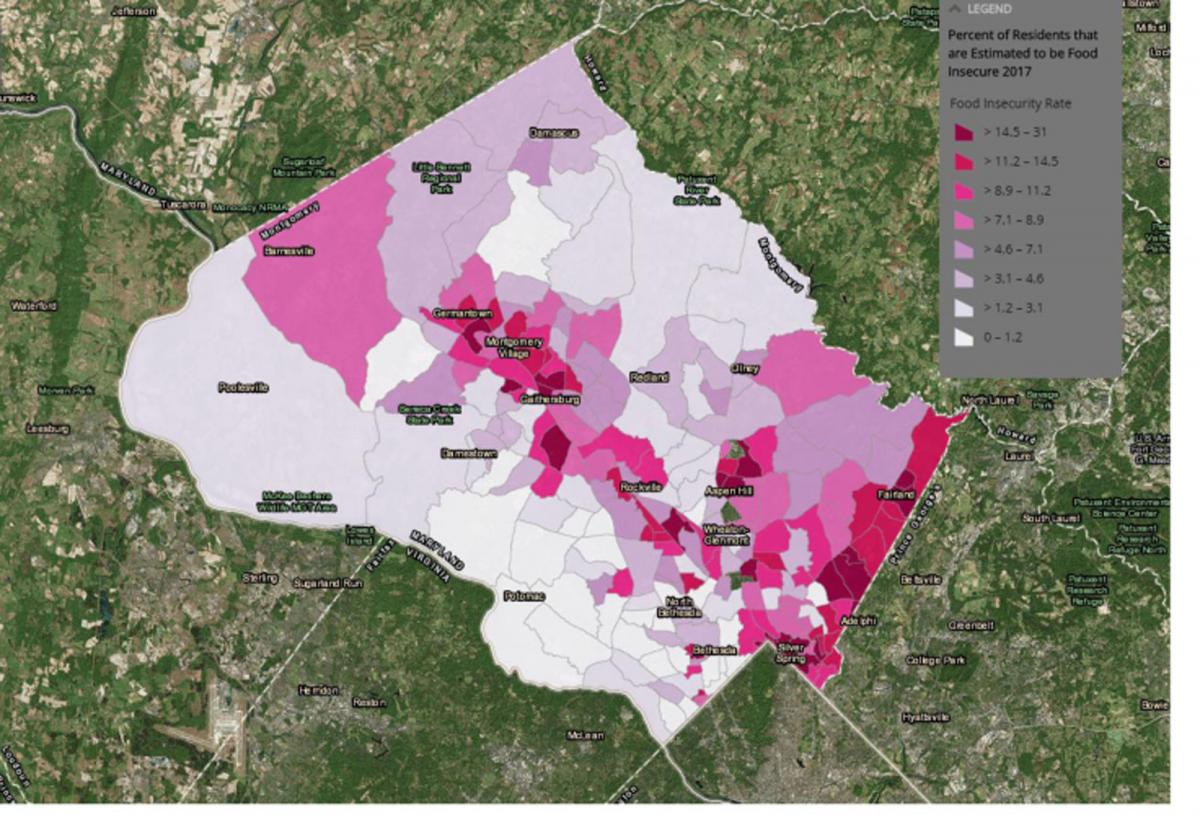
Figure 1. FoodStat. In 2016, there were 63,800 people estimated to be food insecure in Montgomery County, Maryland. This map shows where they live.

Figure 2. TNI Initiative. The map shows the set of six transforming neighborhoods initiative (TNI) areas based on CountyStat analysis, in purple (original) and red (new). The green areas were original TNI areas that were replaced and are now community led.
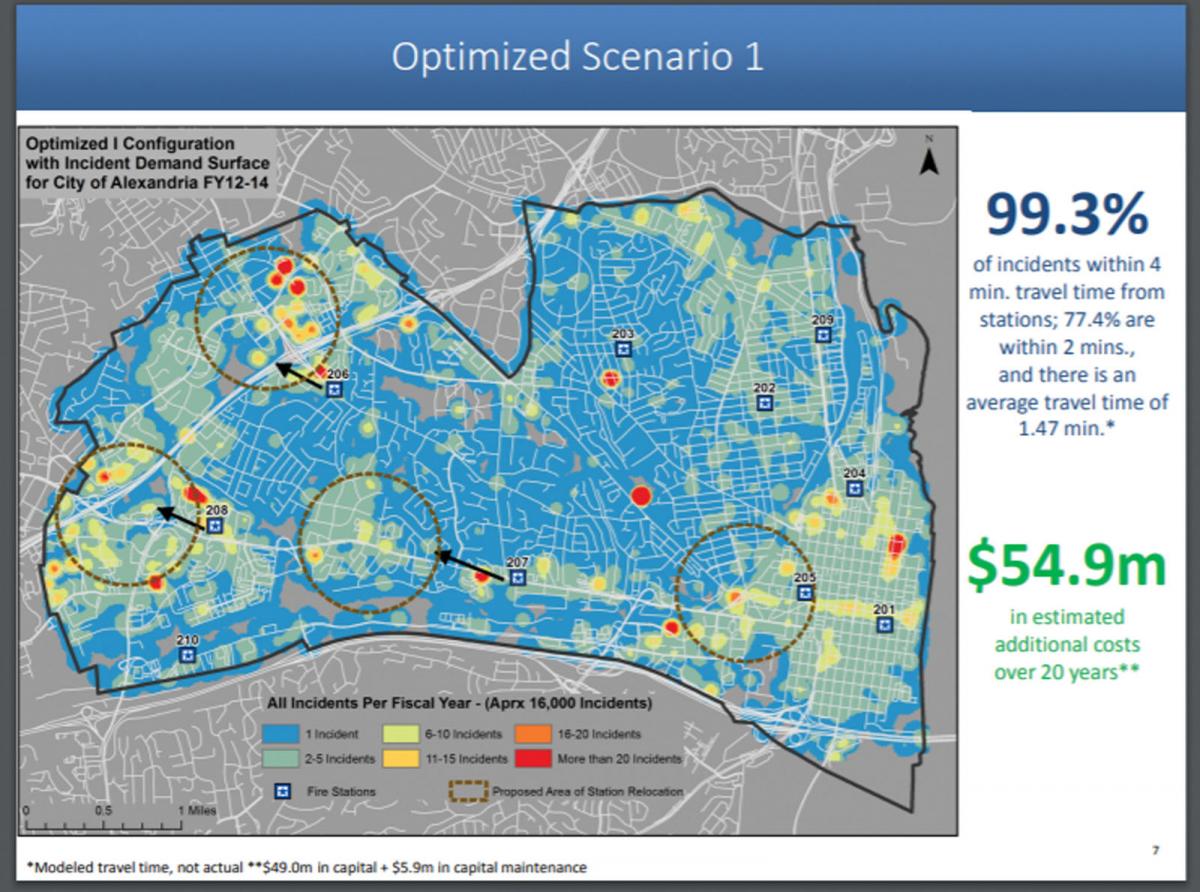
Figure 3. Fire Station Analysis. The map is an analysis of response time and cost for optimizing the configuration of 10 existing fire stations, Alexandria, Virginia.
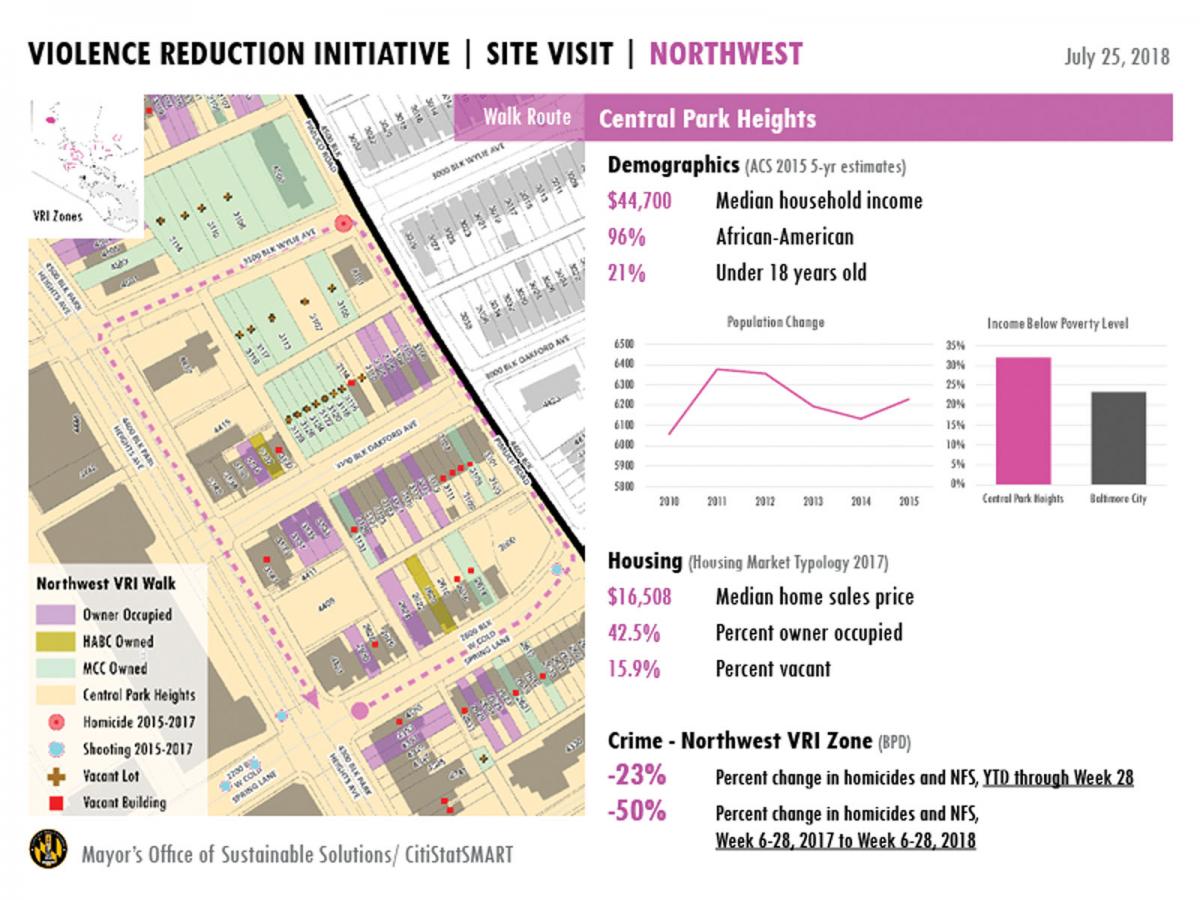
Figure 4. Violence Reduction Initiative.
New, Reduced Membership Dues
A new, reduced dues rate is available for CAOs/ACAOs, along with additional discounts for those in smaller communities, has been implemented. Learn more and be sure to join or renew today!