
May is Mental Health Awareness Month and with it comes the opportunity to bring renewed attention to the growing mental health crisis currently gripping the nation. This crisis cuts across regions, race/ethnicity, age, and socioeconomic status, and though not solely caused by, was accelerated and exacerbated by the COVID-19 pandemic, with symptoms yet to return to pre-pandemic levels.
Cities continually grapple with how to address complex environmental, socioeconomic, and systemic issues that affect resident health. Along with physical health, mental health is partially driven by one’s access to resources and opportunity, and social connections to friends, family, and community. Yet as cities strive to develop creative public health solutions that can respond to the unique needs of their communities, significant gaps in resources to support these changes often exist at the local level.
Data can help reveal trends in mental health challenges and provide the information necessary to help cities work to address them, improving overall health and well-being.
The City Health Dashboard and Congressional District Health Dashboard are two free online tools that provide granular data on health and the social drivers of health for U.S. cities and congressional districts, respectively.
Developed by the Department of Population Health at NYU Grossman School of Medicine, both tools provide users with a broad view of population health, highlighting socioeconomic and environmental drivers, like unemployment and air quality, as well as more traditional health outcomes, such as diabetes and hypertension rates. City managers and other municipal leaders can also find a number of metrics related to mental health, ranging from frequent mental distress to firearm suicides and opioid overdose deaths. Armed with these local data, communities can more effectively address mental health challenges through community engagement, program design and implementation, policy making and resource allocation.
Diving into City-Level Data and Trends
The City Health Dashboard (CHDB) offers leaders in government, nonprofits, education, media, and the community a resource with which to find local data on over 40 health measures for nearly 1,000 U.S. cities. Any city with a population of 50,000 or larger is included on the website, and a growing number of smaller places are added each year. The dashboard also provides users with features like the ability to compare city performance on any metric with peer cities; view data broken down by race/ethnicity, age, and sex; and compare two metrics at once. The site also provides multi-year data for many metrics, with some measures, like opioid overdose death rates, going back to 2012.
We took a look at rates of self-reported frequent mental distress between 2014 and 2021 to better understand the state of mental health across the dashboard’s cities before and during the pandemic. See Figure 1.
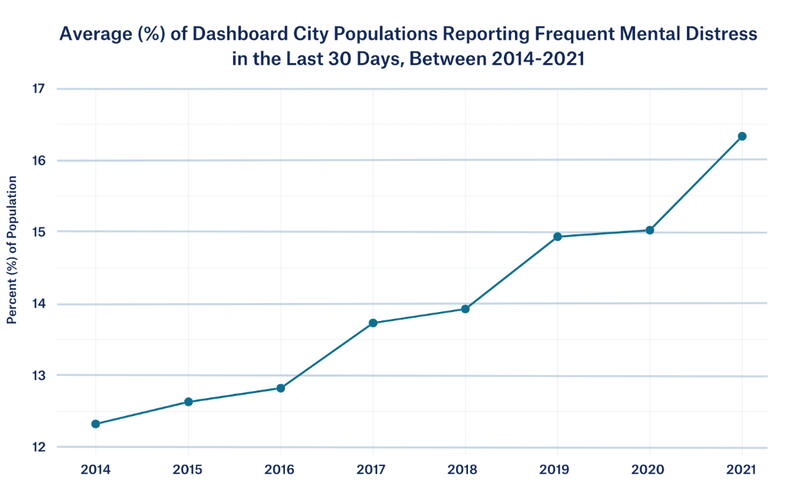
Public health campaigns have worked hard to raise awareness of the ongoing mental health crisis, including a recent Surgeon General’s Advisory on the epidemic of loneliness, but despite these initiatives, new years of data continue to show a steady increase in frequent mental distress nationwide through 2021. College cities — defined by the dashboard’s City Type Report — and towns near college campuses consistently had among the highest levels of frequent mental distress. With reported frequent mental distress increasing by nearly 33% over the past seven years, cities are working hard to address this enormous challenge, investing in help lines, refining mental health screening, improving access to benefits, and more.
The State of Mental Health in U.S. Congressional Districts
Building off the experience of creating and managing the City Health Dashboard, the NYU team launched the Congressional District Health Dashboard (CDHD), in partnership with the Robert Wood Johnson Foundation, in January 2023.
The CDHD is a first-of-its-kind resource, offering data on 37 measures of health and its drivers for all 50 states and 435 U.S. congressional districts (and Washington, D.C.). Most of these measures are the same as measures available on the City Health Dashboard. City leaders can use these two tools together to get a better understanding of both regional and local challenges, support engagement with elected federal officials, and leverage federal opportunities to advance local change, including infrastructure grants and brownfields initiatives.
Since launching last year, the Congressional District Health Dashboard has expanded to include census tract–level data and multi-year data for many of its measures, including frequent mental distress, firearm suicides, and opioid Overdose Deaths. As the team worked with these data to investigate potential relationships between these metrics, several interesting observations emerged.
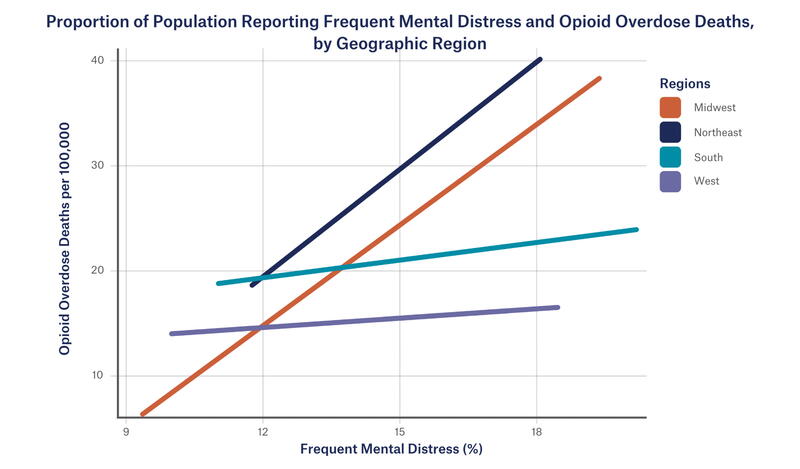
Frequent Mental Distress and Opioid Overdose Deaths
There is a positive, though modest, correlation between opioid overdose deaths and frequent mental distress across regions of the country, which is stronger in the Midwest and Northeast. See Figure 2. Examining the relationship between frequent mental distress and opioid overdose deaths in your locale could provide insights into potential approaches to prevention and care.
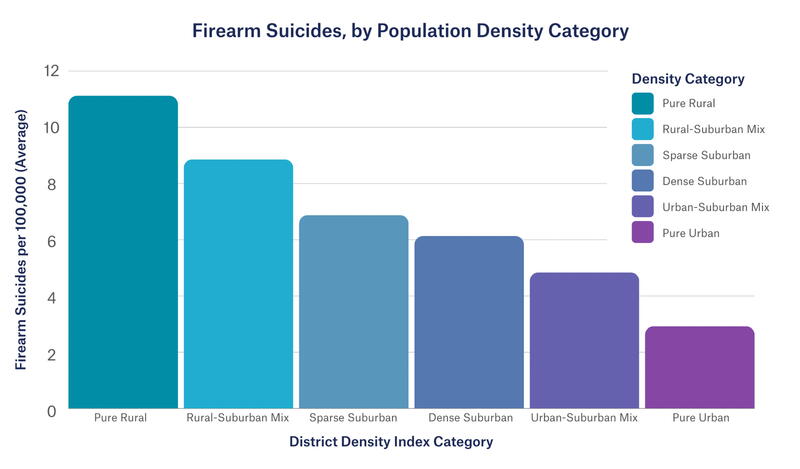
Firearm Suicides by Population Density
Population density can also provide additional context when exploring health outcomes in a community. This is because places with higher population density tend to have more health-promoting resources like parks, community health clinics, and well-paid jobs. Conversely, places with lower population density may lack needed services, requiring residents to travel long distances to receive the care they need or to access needed resources in other ways.
Last year, the Congressional District Health Dashboard released the District Density Index to categorize districts across a population density spectrum, from pure rural to pure urban. Firearm suicides tend to decrease as district density increases, meaning that firearm suicides tend to be higher in pure rural districts and lower in pure urban districts. This pattern holds across all demographic groups. If we look at trends by sex, males in pure rural districts are six times more likely to die by firearm suicide than males in pure urban districts. Males also tend to die by firearm suicide more often than females across districts of all densities. See Figure 3.
Conclusion
Exploring mental health data like that provided on both the City Health Dashboard and Congressional District Health Dashboard is an important first step in understanding this pervasive challenge at the city, congressional district, and regional levels, and from a demographic standpoint. The data can provide evidence for prioritizing focus on this widespread, urgent public health concern and enhancing your city’s programmatic and policy responses to best support this vital facet of resident and community well-being.
Explore city data on the City Health Dashboard and congressional district data on the Congressional District Health Dashboard today.

SAMANTHA BRESLIN is the program supervisor for the City Health Dashboard and Congressional District Health Dashboard, both housed at the NYU Grossman School of Medicine in the Department of Population Health.
New, Reduced Membership Dues
A new, reduced dues rate is available for CAOs/ACAOs, along with additional discounts for those in smaller communities, has been implemented. Learn more and be sure to join or renew today!